Establishment of the Turgo turbine as a viable and market-ready choice for micro-hydropower manufacturers in Nepal.
Improve access to the Turgo turbine for local manufacturers in Nepal and globally.
project Team:
Principal Investigator
Mr. Biraj Gautam
PEEDA
Activity Leader (TTL)
Mr. Prajwal Sapkota
KU
Project Partners
People, Energy & Environment Development Association (PEEDA)
Nepal
Nepal Yantra Shala Energy (NYSE)
Nepal
University of Bristol (UB)
UK
Turbine Testing Lab (TTL)
Nepal
Hydropower Empowerment Network (HPNET)
Funding Agency
EnergizeNepal Project, KU
Summary
The project was funded by EnergizeNepal and lead by People, Energy & Environment Development Asso-ciation (PEEDA). The project aimed to establish the Turgo turbine as a viable choice for manufacturing in micro hydropower plants. The project was jointly carried by five different organizations with their own in-dividual responsibilities. University of Bristol provided lead on design & scaling of Turgo turbine with manufacturing drawing provided to Nepalese manufacturer Nepal Yantra Shala Energy. Nepal Yantra Shala manufactured all the turbine components and installed it to a micro hydropower site at Taplejung district of Nepal. Turbine testing lab (TTL) performed on site performance monitoring of the installed tur-bine and collected different field data related to the project. Hydropower Empowerment Network (HPNET) had responsibility to facilitate dissemination about Turgo turbine globally. The project leading organization, People, Energy & Environment Development Association (PEEDA) coordinated among all of the partners from design, manufacturing, installation, testing to dissemination of experiences & knowledge generated during the project.
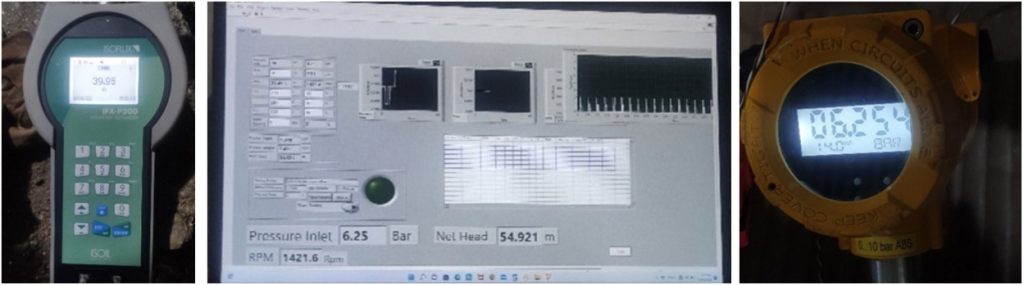
The performance testing consists of measurement of Pressure, Flow, RPM, Electrical Voltage, Electrical Current and Power Factor. Turbine testing lab performed performance testing in two phase at the site. During the first phase flow measurement was carried out using V-Notch weir. The measurement with the V-Notch weir was limited to flow less than 45 l/s due to the size of the canal and higher degrees of uncer-tainty. In the other phase, flow was measured using an Ultrasonic flow meter with much more accurate measurements. The head of the power plant was determined to be around 54m. The experiments were performed varying the flow of water using spare needle valve. Flow of the water through the pipe was var-ied from 15l/s to 105 l/s. During the testing, lowest efficiency was measured to 53% at full valve open con-dition. At, mid flow range the efficiency varied from 65% to 70%.
Figure: (a) Flow measurement using ultrasonic flowmeter, (b) Pressure measurement using absolute pressure sensor, (c) data acquisition using LabVIEW software.